Queue Performance by Period and Queue Group Performance by Period
The Queue Performance by Period and Queue Group Performance by Period charts offer visual representations of Queue and Queue Group Performance by Period statistics, grouped by the type of statistic displayed. Three different series of statistics are available to view in charts:
- Integer—displays numerically-based real-time statistics
- Percentage—displays percentage-based statistics
- Time—displays time-based statistics
The following figure displays a Queue Performance by Period chart displaying the default statistics of the Integer series.
Figure 1. Queue Performance by Period chart
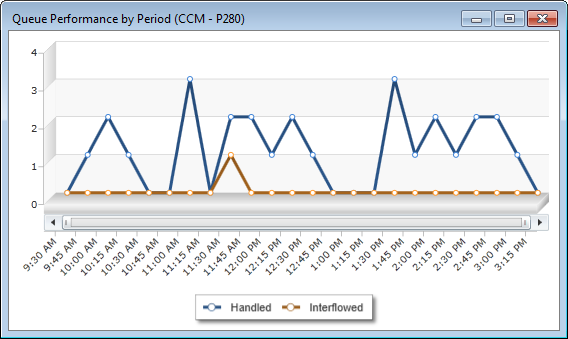
The Integer series shows the following statistics across 15 minute intervals for queues or queue groups:
- Handled (Default)
- Interflowed (Default)
- Offered
- Short Abandoned
- Abandoned
- Requeue
- # Handled by 1-4
The Percentage series shows the following statistics across 15 minute intervals for queues or queue groups, by default:
- % Handled by 1-4
- Service Level % Today
- % Handled
The Time series show the following statistics across 15 minute intervals for queues or queue groups, by default:
- Average Time to Handle
- Average Time to Abandon
- Average Time to Interflow
- Ttl Talk Time
- Average Talk Time
- Total work timer minutes
- Total make busy minutes
- Total occupancy minutes
For more information for the definitions of these statistics, see "Queue by Period column heading definitions".
- Requeue
- # Handled by 1, 2, 3, 4
- % Handled by 1, 2, 3, 4
- Total work timer minutes
- Total make busy minutes
Note:
The following statistics are for ACD path voice queues only and will not display information for Ring Groups:
- Requeue
- # Handled by 1, 2, 3, 4
- % Handled by 1, 2, 3, 4
- Total work timer minutes
- Total make busy minutes
↑